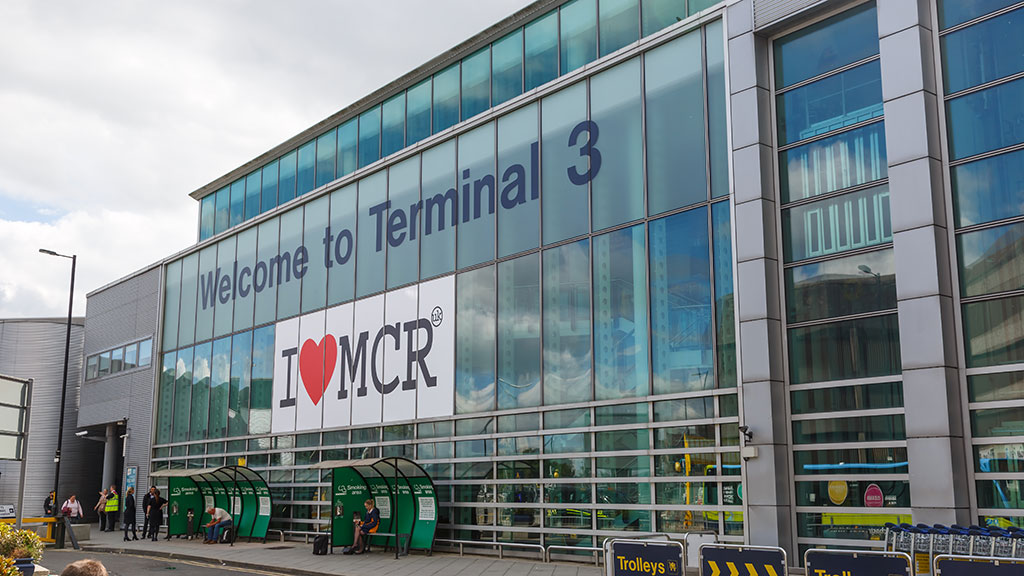
Manchester Airport’s Terminal 3 has been named the worst airport in the UK in the 2026 Which? passenger survey, recording a customer score of just 52 per cent and two stars in every category assessed, from cleanliness to seating.
For business travellers the results are more than a league table. The survey weighs the factors that decide whether a trip starts on time, including late cancellations, check-in queues, passport control queues and food and drink outlets, and it shows a wide gap between the best and worst UK airports.
Two-hour queues and long walks at Manchester
Terminal 3, which mainly handles Ryanair services, drew some of the sharpest criticism in the survey. One passenger described it as “quite appalling for a supposedly modern airport”, reporting a two-hour wait to check in after machines broke down, 20-minute queues for cafes and toilets, and “nowhere to sit”. Another said the terminal suffered from a “poor layout” and a “lack of passenger consideration”.
Walking distances were singled out as “excessive”. Security and the lounges currently sit in the former Terminal 1 area, which formally closed last November, so passengers face a lengthy trek before reaching the gate. Manchester Airport told Which? that a “project ongoing to remove and replace the old travelators” forms part of a multi-million pound refurbishment, work we reported on when construction began on the Terminal 3 renovation. The airport’s own account of the scheme is on its official media centre.
Luton was the lowest-scoring London airport and second worst in the country on 57 per cent, earning two stars in most categories and three only for baggage reclaim wait and cleanliness. Anyone flying from there for work will find practical tips in our Luton airport guide. Manchester’s Terminal 2 was third from bottom on 58 per cent, matched by London Stansted, while Edinburgh scored 61 per cent.

Exeter tops the best and worst UK airports table
At the other end of the ranking, Exeter was crowned Britain’s best airport with an 83 per cent customer score and five stars for check-in queues, security queues and cleanliness. Its weakest area was food and drink outlets, at three stars. One passenger called it “a lovely little place”.
Liverpool John Lennon came second on 79 per cent and London City third on 78 per cent, the highest of the capital’s six major hubs and a result that will not surprise regular users of the capital’s most efficient airport. Norwich, Cardiff, Bournemouth, East Midlands and Southampton all scored 74 per cent or better, reinforcing a pattern across the survey: small and medium-sized airports deliver a smoother journey than the big hubs.
What it means for business travellers
The practical lesson is that terminal choice matters as much as airline choice. Heathrow’s Terminals 4 and 5 both scored 66 per cent, well ahead of Terminal 3 on 62, and at Manchester the six-point gap between T2 and T3 is the difference between a routine departure and a risky one. Where a regional airport serves your route, the data suggests it will save time and stress, and for tight morning meetings a buffer of extra time at the lower-ranked terminals looks prudent.
AirportsUK, the trade body for the sector, rejected the findings. A spokesman said: “These results do not align with our airport members’ own data on passenger experience, which shows that most customers are very happy with the service they receive. This is seen in comprehensive surveys of thousands of people every single month, while Which? has only asked a tiny and unrepresentative fraction of airport passengers to recall their experiences up to a year previously.” The full Which? airport ratings are published on its website.
For a wider view, see who we think is the best airport in the world in the Travelling for Business Awards 2026 finalists.
UK airports ranked best to worst (Which? customer score)
- Exeter, 83 per cent
- Liverpool, 79 per cent
- London City, 78 per cent
- Norwich, 78 per cent
- Cardiff, 77 per cent
- Bournemouth, 76 per cent
- East Midlands, 75 per cent
- Southampton, 74 per cent
- Belfast City, 73 per cent
- Newcastle, 73 per cent
- Glasgow, 70 per cent
- Aberdeen, 68 per cent
- London Heathrow Terminal 4, 66 per cent
- London Heathrow Terminal 5, 66 per cent
- Belfast International, 64 per cent
- London Heathrow Terminal 2, 64 per cent
- Birmingham, 63 per cent
- London Gatwick (North), 63 per cent
- London Gatwick (South), 63 per cent
- Bristol, 62 per cent
- Leeds Bradford, 62 per cent
- London Heathrow Terminal 3, 62 per cent
- Edinburgh, 61 per cent
- London Stansted, 58 per cent
- Manchester Terminal 2, 58 per cent
- London Luton, 57 per cent
- Manchester Terminal 3, 52 per cent